- Research Article
- Open access
- Published:
Masking of Time-Frequency Patterns in Applications of Passive Underwater Target Detection
EURASIP Journal on Advances in Signal Processing volume 2010, Article number: 298038 (2010)
Abstract
Spectrogram analysis of acoustical sounds for underwater target classification is utilized when loud nonstationary interference sources overlap with a signal of interest in time but can be separated in time-frequency ( ) domain. We propose a signal masking method which in a
  plane combines local statistical and morphological features of the signal of interest. A dissimilarity measure
  of adjacent
  cells is used for local estimation of entropy
  , followed by estimation of
  entropy difference, where
  is calculated along the time axis at a mean frequency
  and
and  is calculated along the frequency axis at a mean time
  of the
  window, respectively. Due to a limited number of points used in
  estimation, the number of possible
  values, which define a primary mask, is also limited.
  secondary mask is defined using morphological operators applied to, for example,
  and
and  . We demonstrate how primary and secondary masks can be used for signal detection and discrimination, respectively. We also show that the proposed approach can be generalized within the framework of Genetic Programming.
1. Introduction
In navy applications one needs to intercept and classify pings of an unknown sonar in presence of unknown number and type of interferers. Analyzed signals depending on duration in time ( ) and extent in frequency (
 ) are divided into two broad categories: narrow-band (
 ) (
) ( ) and broad-band (BB) (
 ). Passive detection of signals with
  and
and  components is usually based on separate approaches (see, e.g., [1]). Typical waveforms in active sonar surveillance are continuous waveform at a constant frequency and amplitude, and frequency modulated waveform. These waveforms are also relevant in passive acoustical analysis, for example, in ping interception and classification. Appearance of these signals in spectrograms depends on the temporal extent of data which is used to estimate a single periodogram, on the amount of overlapping periodograms, and on the weighting window.
After defining the time-frequency ( ) parameters required for spectrogram processing, and general expectation about expected signals, one has to answer the question: what features of detected
  and
and  signals are sufficient for a target classification? Extended feature analysis is required for analysis of active echoes to discriminate between targets and clutter. A sound timbre is an example of a perception-based feature (see, e.g., [2]). However, in the case of strong interfering signals, or in the case of limited number of sensors (e.g., single sensor), isolation of the full
  signature of a target may not be possible. In such a case one may try to characterize the detected energy peaks locally, that is, not just by the frequency of detected signal peak and its amplitude but also by spectral energy distribution in close proximity of the detected peak. Classification of spectral peaks is addressed in [3, 4]. Moreover, [5] performed spectrogram segmentation by deciding whether each spectrogram point (
 coefficient) belongs to some deterministic component region or to noise (or background) region. They pointed out that to perform such a decision one needs more than the energy level. The authors chose to utilize local statistical features so that these features aggregated in feature space.
The present approach also concentrates on local  cell statistics of an input spectrogram image
  . We are interested in testing for presence of a signal of interest (
 ) in a given
  cell regardless of a number and type of waveforms of interfering sources (
 ).
).
We use two basic assumptions: ( )
)  and
and  most of the time do not overlap in
  space; (
 ) both
  and
and  exhibit a high
  .
.
Typically in active radar/sonar applications a non-parametric approach is used when one hopes to create a simple detector which is insensitive to environment at a cost of some deterioration in performance as compared to the detectors optimal in Neyman-Pearson sense [6–8]. Since in our case the number and type of waveforms of  may change, we approach this problem in the framework of machine learning of one class classification [9, 10]. However, as opposed to the machine learning approaches (e.g., support vector machine or neural networks which put out complex classifiers and are prone to over-fitting), we propose a simple two-step approach. It combines statistical processing and morphological operations to obtain time-frequency masks of
  . We show that the simplicity of our approach lies in the fact that even after visual inspection of images of proposed features, it is possible to construct masks which can be used for masking and discrimination of
  . Moreover, we show that the proposed interactive feature selection and construction of masking rules can easily be generalized in a framework of Genetic Programming (GP) [11].
The proposed approach will be described in Section 2. Section 3 will present examples of the proposed approach. While the first three examples will show details of the approach where feature manipulation is based on visual image inspection, the last example will present performance measures over a wide range of peak-to-peak ratios based on a mask created using GP. Finally, a summary and conclusions will be given.
2. Approach
2.1. Overview
A block-scheme of the proposed approach is shown in Figure 1. We start the explanation of the proposed approach with a short summary followed by a detailed explanation of each step.

The Statistical (A, D) and Morphological (B, C, E) Data Processing Flow. A—Spectrograms  are a subject to MMD test, the ouptut of which
  are used for estimation of entropy H and difference of entropies
  ; B—The images of features (filled squares) are used to form
  . The feature vectors
  corresponding to SI are labeled by
  and by
  in the opposite case; C—mask of signal of interest in a form of GP tree; D—statistical processing of a test spectrogram
  ; E—features estimated in D are used for testing the masking algorithm C.
The approach consists basically from two steps: the statistical image processing of one or more spectrograms  (Figure 1A) and the construction of masks that comprise feature selection and their combination using some heuristic rules (Figures 1B and 1C). More than one spectrogram may be needed for inspection of feature images under changing environment. At the end of this section we show that a combination of features and heuristic rules can be presented in a form of a syntax tree of GP, which provides a framework for generalization of
  masking.
The first part of statistical processing is based on the Maximum Mean Discrepancy test ( ) which is carried out on a pair of
  cells within a sliding
  window. By moving the
  window at maximum time and frequency resolution, correlated
  estimates of dissimilarity
  of
of  cells are obtained. To estimate the information content of
  distribution (Figure 1A), the local entropies
  and
and  which differ in their
  support, respectively, are calculated. As a result the six images (the reason for six instead of three images will be apparent from the next section) of the features of estimated spectrogram are used to define a set of feature vectors
  (Figure 1B).
2.2. Maximum Mean Discrepancy
We apply the Maximum Mean Discrepancy test (henceforth dissimilarity) on a pair of adjacent time-frequency cells in a  window with a predefined time and frequency support. We apply this test to quantify dissimilarity of neighboring
  cells. Theoretical background and details about the
  test can be found in [12]. An empirical biased estimate of
  defined for the pair of
  cells, centered at
  ,
,  and
and  ,
,  , respectively, can be written as

where  and
and  are vectors defined on normalized values of power spectral density
  of the
  window of the first and second
  cells, respectively, (see Figure 2), and
  is a kernel function. In this work we used the Gaussian radial basis function
 , where
  is a scaling parameter. Values of the dissimilarity measure (1) vary between
  and
and  . The
. The  intensity values
  were normalized by the
  norm, that is,

The  test of a pair of
  cells can be carried out along frequency or time axes.In the former case, both cells have a common time span, with a mean time
  and different frequency intervals. In the latter case, both cells have a common frequency span, with a mean frequency
  , and different time intervals (see Figure 2). For BB signals the highest gradients of spectral power are observed along time axis. Conversely for the NB tonals and associated harmonics, the highest gradients are observed along the frequency axis. We denote the corresponding
  tests broad-band (
 ) and narrow-band (
 ) detection tests, respectively. However, there will be cases when BB signals extend only over a certain portion of spectrogram, and have sharp gradients both in time and frequency, or when NB signals are not pure tonals, as in the case of frequency-modulated signals. In such cases,
  and
and  tests detect also portions of
  and
and  signals, respectively. The respective
  tests are then given by the equations:

By moving a  window step by step at the time and frequency resolutions of the spectrogram, one obtains both
  and
and  distributions. Each of the distributions will exhibit locally correlated values in the
  plane. Inspecting numerous
  (below we will drop subscripts
  or
or  when talking about both
  and
and  changes) distributions, it was noticed that for certain values of the Gaussian scaling index
  of the kernel,
  exhibits only small changes in statistically homogeneous areas and significant changes in areas of strong spectral energy variations. Usually in the
  test the scale factor
  is tuned so that no change would correspond to
  and a significant change would correspond to
  . However, since reusable
  values are desired, rather than fine tuning the scale parameter,
  distributions were inspected based on a constant
  using a diverse dataset. For
  , the areas of relatively homogeneous distribution of power spectral density were close to some constant value (e.g., 0.4), while in the areas of significant changes
  values fluctuated relative to this average. Entropy (
 ) estimation provides a consistent way to quantify information related to these changes, irrespectively of actual
  values. As in case of
  estimation, the estimated
  had also a local TF support (an example will be shown in Section 3).

Cartoon of a pair of time-frequency cells ( and
and  ) placed in a time-frequency window (surrounded by the thick dotted line) is shown using two different gray shades. Panels (a) and (b) show relative location of TFCs used for dissimilarity estimation of BB and NB changes, respectively. The red filled circles in the middle of the TF cells correspond to the mean values of time (tc) and frequency fc of respective TF window.
2.3. Entropy Estimation
Since the changes observed in a spectrogram were divided into two broad categories of NB and BB signals, entropy distributions for both NB and BB tests were estimated. Besides  estimation, based on the local 2D TF support, 1D support of entropy
  was performed. A cartoon summarizing time-frequency support of all features is shown in Figure 3. To compare directional
  changes, the
  estimation was carried out pairwise; entropies were estimated along a time axis at a mean frequency and along a frequency axis at a mean time so that the respective pair had a common reference point centered in the TF window. Moreover, by limiting the number of grid points used for entropy estimation along a grid line in a single direction, the number of entropy values was also limited. In this work, the smallest number of points, three (one to each side of a reference point), was used, that is,

where the probabilities  were based on histograms estimated using three points (e.g.,
  ,
,  , and
, and  ):
):

The sign of the difference between the pair of entropies, calculated in time and frequency directions, stresses either  or
or  changes, respectively:


Cartoon summarizing TF support of statistical features.
Note that the constraint  is used here only for simplicity; later within the GP framework it will be removed. By using all values with the same sign and including
  , the number of possible values of
  is four. In the next section it will be shown how the respective sets can be used to obtain binary masks. These masks are the primary binary masks since these masks are sufficient for signal detection purposes. In presence of strong interferences (e.g., jamming [13, 14]), discrimination of detected signals is required. This motivated creation of a second set of binary masks. Again, derivation of the secondary masks should be local in the TF plane with a possibility of global optimization of the features, used in derivation of the binary masks, for global discrimination analysis. One of such features, the local entropy based on two-dimensional
  distribution, was calculated, that is,

where probability  was defined using one-dimensional histogram
  based on stacked data of two-dimensional
  distribution values within a TF window:

2.4. Construction of Time-Frequency Masks
2.4.1. Visual Analysis
Taking  in (5), the primary masks were constructed using the following set
 . Below we will use three primary masks:

To construct the secondary masks four generic rules were used. For the feature matrices  (e.g., NB entropy),
  (e.g., BB entropy), and
  (e.g., spectral data) these generic rules were as follows:

where  and
and  refer to the time and frequency indices, respectively. The fourth rule was based on morphological dilation operator implemented recursively on (primary) masked data with the increasing span of the structuring element:

In the next subsection we will point out a way to generalize the construction of masks given above.
2.4.2. Genetic Programming
In Genetic Programming programs are represented as syntax trees. A tree includes nodes, which indicate instructions to execute, and links which point to inputs (or terminals) used for execution of instructions [11]. Initially a random set (or population) of trees (or programs) is created and executed recursively following chosen instructions. Using some fitness measure on results of program execution, only a few programs are selected which are then used to generate new programs using some predefined genetic operations. Selection of the fittest programs followed by genetic generation of new programs is repeated until some predefined criteria are met. The final result is given in a form of syntax tree.
In our case, any (i.e., primary and secondary) of the masks developed above can be presented as a syntax tree. For simplicity we take a primary mask  defined in the previous section. The feature images (both NB and BB)
  ,
,  , and
, and  can be used to form feature vectors
  (note that in most practical cases a feature vector will be defined not just at a single pixel pixel
  but also at neighboring
  ,
,  ,
,  ,
,  pixels). The members of
  can be then used as inputs to the syntax tree (Figures 1B and 1E ), which in turn can be evaluated iteratively. An example of primary mask presented in a form of the syntax tree is shown in Figure 4. In the present case, selection of nodes, inputs, and links forming the tree is carried out interactively. It is straightforward in a case of construction of primary masks (9) and is more complicated for the secondary masks. However, by using the masking approach in GP framework, a generalized method for detection and discrimination of
  can be obtained. In the next section we will show three concrete examples based on combination of primary and secondary masks developed earlier. The proposed approach will be then generalized in GP framework to show its ability to work in a wide range
  -
- peak-to-peak ratios.

The primary mask
 (9) presented in a form of the syntax tree.
3. Algorithm Development and Application
3.1. Construction of Masks Using Visual Analysis
All given examples consider the case when only a single sensor is available for recording of acoustical data. We construct two masks: primary and secondary. By applying the primary mask, we expect to detect the signals of interest along with the interfering signals. The secondary morphological mask is used then to discriminate between a deterministic  , random
  Gaussian, and
  interfering signals. Three cases will be considered. The first case simulates a deterministic damped sinusoidal signal against a background of weaker random Gaussian interference and recurring BB signals (e.g., modeling pings of own ship echo-sounder). In the second, a more difficult case, the situation is reverse. Now the
  interference is stronger than the recurring signal of interest at the background of uniform noise and recurring
  signal. Finally, a recording of a bird song [15] will be considered. We chose the bird song instead of, for example, marine mammal because the corresponding file is accessible from the Internet, so that the interested parties can carry out similar calculations using the same data. The bird song example also exhibited a mixture of
  and
and  features, from which we were able to extract
  components.
The raw time series were simulated as a sum of (i)  Gaussian pulses (
 interference) at randomized central frequencies, which were generated by passing white noise through a narrow-band digital filter [16]; (ii) broadband Ricker wavelets (
 interference); (iii) deterministic damped
  pulses (signal of interest) recurring at the time interval 0.53 s and central frequency 7500 Hz; and (iv) uniform white noise. Two different examples were generated using different amplitude ratios of the components. Values of the parameters used in the estimation of spectrogram features are given in Table 1.
 ,
,  ,
,  ,
,  ,
,  ,
,  are number of pixels used to define TF windows of
  ,
,  , and
, and  , respectively;
  and
and  show spectrogram frequency and time resolution;
  —sampling frequency.
The ratios of the peak values of signals, as well as signal versus background, are shown in Table 2. Figures 5(a) and 5(b) show the respective spectrograms. Note that while the signal and background noise ratios are different in Figures 5(a) and 5(b), the geometrical appearance of the signal as compared to the interfering random signal has not been changed. In both cases the signal bandwidth (defined as 15 dB decrease from the signal's peak value) is about 800 Hz. A similar decrease in the interfering signal is observed at a bandwidth equal to roughly a doubling in the value of the spectral resolution (i.e., 117 Hz). Also note that while the signal duration is comparable with the spectrogram time resolution (one pixel), the duration of the  interfering signal is about 4 pixels (i.e.,
  ). Finally, in both cases
  interference could be observed over most of the frequency span of spectrogram with a duration of 0.0171 second (1 pixel).
 ), random
  interference to
  (
( ), deterministic broadband interference to
  (
( ), and
  to random
  interference (
 ) for experiments
  and
and  .
.
The rows from top to bottom: spectrogram, the first primary mask, the second primary mask, and the secondary mask for experiments given by columns from left to right: one (weak NB interfering signal), two (strong NB interfering signal), and three (bird call).
An example of the distribution of features used in present work is shown in Figure 6 for detections of strong (a) and weak (b) signals. An example of local TF support used in the first experiment is shown by the red boxes ( and
and  support) and red crosses (
 support). Information about the geometrical appearance of underlying distributions was used to construct secondary binary masks based on local statistical and morphological operators. Below it will be shown that while the primary mask can be used effectively for detection of signal of interest as well as interfering signals, the secondary masks can be used for reduction of false alarms due to interfering signals. Detection of
  or
or  signals in the context of the present approach has the meaning of carrying out a dissimilarity test in frequency or in time direction, respectively. From point of view of these tests, the BB signals with
  but
but  can be regarded as either
  or
or  signals depending on a final goal. Although both
  and
and  tests were performed in each experiment, the primary mask was based on only one. In the first two examples
  was used, and in the third test with a bird call,
  was used.

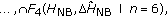
Local distribution power spectral density (X), dissimilarity DNB, entropies HNB and HBB and entropy difference  for the areas marked by black boxes in Figure 5(a). The upper row corresponds to the box covering a signal of interest at 7500 Hz, and the lower row corresponds to the interfering signal covered by the lower frequency. The two red rectangles and the red cross in the figure correspond to the TF windows needed for D test (leftmost panels), and H estimation (the second column from the left), respectively. Note that scaling in pixels is different for the upper and lower rows.
In all three experiments the  detection given by (3) was used to derive the primary masks. The results of the application of the primary masks are shown in the two middle rows of Figures 5(d) and 5(e) were obtained using the primary mask
  , Figure 5(f) using
  , and Figures 5(g)–5(i) using
  of (9). Figures 5(j)–5(l) were obtained using secondary masks given in the order of the experiment number (1 corresponds to (j); 2 to (k), and 3 to (l)). The respective secondary mask implementation was given by
-
(1)
 ,
, -
(2)
 ,
, -
(3)
 ,
, 
 ,
, ,
, ,
, 
where superscript  implies a matrix transpose. While in the first (strong signal) and the third (bird call) cases different combinations of secondary masking gave quite consistent results with different choices of a secondary mask, in the case of the second experiment with strong interference and weak signal the results of false alarm reduction were sensitive to the choice of the secondary mask. In general one can see that the primary masks worked well for detection of signal of interest in all three experiments.
Visual inspection shows that in the first experiment most of the NB signals were detected, while BB interference remained undetected as required (except the bottom row, shown by a continuous black line, which was related to the reduced number of grid points at the beginning of masking). However, in the second experiment the BB lines can be clearly seen in Figures 5(e) and 5(h). One should recall that since the signal of interest was on a border line between NB and BB signals, for experiments one and two we used a combination of  and
and  tests. In the third experiment however, we used a combination of
  and
and  tests to derive the primary masks. In this case, already the first primary mask was useful for detection of bird call vocalization around 4200 and 6200 Hz. The secondary mask performed simple dilation of the masked data. In the first experiment, the secondary mask successfully masked interfering signals. The second experiment was the most difficult case. In addition to the secondary mask, a median filter was applied, calculated as an absolute difference between median
  and
and  values estimated for each row of the spectrogram. The rows with the respective difference higher than 0.05 were set to zero. As a result, dominant detections were observed as expected at 7500 Hz. In the next section we will show that significant reduction of false alarms can be achieved via mask construction in the framework of GP.
3.2. Performance and Automation of Masking of Time-Frequency Patterns
To evaluate masking performance we modified previously described simulation so that now it incorporated changing  of signal of interest. Each run that lasted about 10 seconds and that was carried out at constant
  was repeated 50 times. Then the
  was increased and another 50 runs were performed. Ten different SNR values were used. The range of SNRs values was chosen so that ratio of maximums of spectral peaks of
  and
and  (
( ) changed roughly from
  to 5 dB. Since
  was deterministic, the number of peaks over 10 second period was constant and equaled to 19. To eliminate redundancy in a number of masked peaks, the respective peaks were clustered using kd-tree closest point search method. The detection probability (
 ) was defined as a ratio between the number of detected (masked) clustered peaks and the true number of peaks, and the false alarm probability was defined as a ratio between of the number of incorrect and number of detected clustered peaks.
To automate masking of  patterns we used an open source Matlab GP toolbox [17]. According to Koza [11], a single set-up of governing parameters of GP can be used to address a wide range of problems. The toolbox's demo script "demoparity.m" was adopted to accommodate for the format of input features vectors and for a list of functions. After these changes, we were able successfully automate
  pattern masking.
The feature vectors centered at a pixel  were defined as
  , where, for example, the first six
  members were
 . The transposed feature vectors formed a matrix with a row labeled by
  or by
or by  depending on presence or absence of
  , respectively. The set of Matlab functions used by GP was
  . The number of populations was set to 350 and program was stopped after 20 generations.
For automated creation of a  mask we used 10 spectrograms, each corresponding to a different
  . The respective spectrograms were processed following the proposed approach (Figure 1). To show the improvement gained by automation of TF masking of
  , we compare the respective results with the results obtained by processing of the same data set using a combination of two primary masks. The masks were constructed using a three by three pixels matrix of
  centered at a given time and frequency of
  obtained at
  and 0 dB PPR, respectively. Presence of
  was declared when either of the primary masks matched exactly underlying
  pattern of
  .
.
Comparing the results of interactive and automated masking (Figures 7(a) and 7(b)) one can see that while in both cases the detection probability was relatively high almost over the whole range of PPRs (except the first estimates at  dB), false alarm rate was significantly lower in the case of automated masking (Figure 7(b)). The
  of the
  signal was kept approximately constant and equal to the value used in the previous experiment.

(a) results of interactive masking. Shown are the detection (Pd) and false alarm (Pfa) probabilities as a function of peak-to-peak ratio (PPR) of SI and IS; (b) the same as in A but for automated masking; (c) SNR of signal of interest and interfering signal; All results are based on 500 runs, 50 runs per each value of PPR.
3.3. Qualitative Comparison of the Proposed Approach to Other Approaches
The first part of this work separated the problem of signal detection and discrimination into two parts, respectively, by defining primary and secondary masks. Finally we showed that both of these problems could be addressed within a single framework of GP.
Separating the problem into two steps is useful in showing how preliminary information can be incorporated into the construction of feature vectors. In this work we assumed that all signals can be presented in one of the two categories: either NB or BB signals. The statistical MMD test followed by estimation of entropies capitalized on this idea by producing features  ,
,  , and
, and  . Clearly the proposed use of MMD test is not the only test that can be used for signal detection in spectrograms. In cases when one has an ability to analyze recorded data over time periods sufficient for track detection, or when signal detection is a part of a tracking approach, a number of approaches can be used for track detection. A recent overview of track detection in spectrograms is given in [18]. More research is required to understand how information gained during signal or track detection can be used for signal or track discrimination. Therefore approaches developed for track detection in spectrograms (e.g., active contour models [19], reassignment, Radon [20] and Hough [21] transforms, simple thresholding) should be complemented by statistical information (e.g., higher statistical moments) obtained in close proximity of detected time-frequency tracks. Additionally, the features based on cepstral processing may be used when one is working with quasiperiodic signals, for example, sonar pings.
For purposes of this work, postprocessing of collected data implicitly provided statistical and morphological information mainly about signal of interest. Since a number and type of interfering sources were assumed to be unknown, the presented problem can be treated as a one-class classification or novelty detection problem. Presented results show that by combining statistical and morphological approaches it is possible to reduce false alarms without the reduction of signal detection rate. It is interesting to note that recently in active sonar measurements the authors of [22] were able to reduce significantly false target detections due to clutter using the two-step statistical-morphological processing.
Finally, it should be noted that the computational complexity  of MMD test (1) is the highest among all processing blocks involved in masking of the test data.
4. Summary and Conclusions
A new approach has been presented for binary masking of signal of interest in presence of narrow-band and broadband interferences in spectrograms. All computations of dissimilarities of TF cells and related entropies required for a binary mask estimation were local in time-frequency space. Rather than thresholding spectrogram data, or related dissimilarity or entropy distributions, the number of grid points used in estimation of entropies and their differences was limited. As a result, the number of values of the respective differences was limited, and these were used to define the primary binary masks, which did not require use of any thresholds for their estimation. An advantage of using dissimilarity rather than spectral energy distribution for entropy estimation was in the known scaling of  , which allowed predefinition of the histogram bin limits. We have shown that while local entropy differences calculated from the
  distribution is an effective way for general signal detection (including interfering signals), then morphological operations can be used to reduce false alarms due to interfering signals. The division of the proposed masking approach into primary and secondary masks is useful if one has to make a distinction between the signal detection and discrimination, or during the interactive construction of signal discrimination processing flow. The presented approach is flexible and can be adopted depending on the underlying problem within a framework of Genetic Programming which unifies the proposed construction of two masks.
References
Pasupathy S, Schultheiss PM: Passive detection of Gaussian signals with narrow band and broad band components. The Journal of the Acoustical Society of America 1974, 56(3):917-921. 10.1121/1.1903347
Young VW, Hines PC: Perception-based automatic classification of impulsive-source active sonar echoes. The Journal of the Acoustical Society of America 2007, 122(3):1502-1517. 10.1121/1.2767001
Zivanovic M, Röbel A, Rodet X: A new approach to spectral peak classification. Proceedings of the 12th European Signal Processing Conference (EUSIPCO '04), 2004, Vienna, Austria 1277-1280.
Zivanovic M, Röbel A, Rodet X: Adaptive threshold determination for spectral peak classification. Computer Music Journal 2008, 32(2):57-67. 10.1162/comj.2008.32.2.57
Hory C, Martin N, Chehikian A: Spectrogram segmentation by means of statistical features for non-stationary signal interpretation. IEEE Transactions on Signal Processing 2002, 50(12):2915-2925. 10.1109/TSP.2002.805489
Thomas JB: Nonparametric detection. Proceedings of the IEEE 1970, 58(5):623-631.
Gandhi PP, Kassam SA: Analysis of CFAR processors in homogeneous background. IEEE Transactions on Aerospace and Electronic Systems 1988, 24(4):427-445. 10.1109/7.7185
Chen H, Varshney PK, Kay S, Michels JH: Noise enhanced nonparametric detection. IEEE Transactions on Information Theory 2009, 55(2):499-506.
Schölkopf B, Platt JC, Shawe-Taylor J, Smola AJ, Williamson RC: Estimating the support of a high-dimensional distribution. Neural Computation 2001, 13(7):1443-1471. 10.1162/089976601750264965
Tax D, Duin R: Uniform object generation for optimizing one-class classifiers. Journal of Machine Learning Research 2001, 2: 155-173.
Koza JR: Genetic Programming: On the Programming of Computers by Means of Natural Selection. The MIT Press, Cambridge, UK; 1992.
Gretton A, Borgwardt KM, Rasch MJ, Schölkopf , Smola A: A kernel method for the two-sample problem. Journal of Machine Learning Research 2008, 1: 1-10.
Mankun X, Xijian P, Tianyun L, Mantian X: A new time-frequency spectrogram analysis of FH signals by image enhancement and mathematical morphology. Proceedings of the 4th International Conference on Image and Graphics (ICIG '07), 2007 610-615.
Liu J, Lee JPY, Li L, Luo Z-Q, Wong KM: Online clustering algorithms for radar emitter classification. IEEE Transactions on Pattern Analysis and Machine Intelligence 2005, 27(8):1185-1196.
Athanas NBrazil, http://www.xeno-canto.org/recording.php?XC=11613
Maranda BH: A method for generating narrowband test signals. In Technical Memorandum. Defence R&D, Atlantic, Canada; 2002.
Silva S: Gplab—a genetic programming toolbox for MATLAB. http://gplab.sourceforge.net/index.html
Lampert TA: A survey of spectrogram track detection algorithms. Applied Acoustics 2010, 71(2):87-100. 10.1016/j.apacoust.2009.08.007
Lampert TA, OKeefe SEM: An active contour algorithm for spectrogram track detection. Pattern Recognition Letters. In press
Copeland AC, Ravichandran G, Trivedi MM: Localized radon transform-based detection of ship wakes in SAR images. IEEE Transactions on Geoscience and Remote Sensing 1995, 33(1):35-45. 10.1109/36.368224
Dixon TL, Sibul LH: A parameterized hough transform approach for estimating the support of the wideband spreading function of a distributed object. Multidimensional Systems and Signal Processing 1996, 7(1):75-86. 10.1007/BF02106108
Ginolhac G, Chanussot J, Hory C: Morphological and statistical approaches to improve detection in the presence of reverberation. IEEE Journal of Oceanic Engineering 2005, 30(4):881-899. 10.1109/JOE.2005.850918
Acknowledgment
A part of this work was supported by the NATO Underwater Research Centre.
Author information
Authors and Affiliations
Corresponding author
Rights and permissions
Open Access This article is distributed under the terms of the Creative Commons Attribution 2.0 International License (https://creativecommons.org/licenses/by/2.0), which permits unrestricted use, distribution, and reproduction in any medium, provided the original work is properly cited.
About this article
Cite this article
Sildam, J. Masking of Time-Frequency Patterns in Applications of Passive Underwater Target Detection. EURASIP J. Adv. Signal Process. 2010, 298038 (2010). https://doi.org/10.1155/2010/298038
Received:
Accepted:
Published:
DOI: https://doi.org/10.1155/2010/298038