- Research Article
- Open access
- Published:
Inferring Parameters of Gene Regulatory Networks via Particle Filtering
EURASIP Journal on Advances in Signal Processing volume 2010, Article number: 204612 (2010)
Abstract
Gene regulatory networks are highly complex dynamical systems comprising biomolecular components which interact with each other and through those interactions determine gene expression levels, that is, determine the rate of gene transcription. In this paper, a particle filter with Markov Chain Monte Carlo move step is employed for the estimation of reaction rate constants in gene regulatory networks modeled by chemical Langevin equations. Simulation studies demonstrate that the proposed technique outperforms previously considered methods while being computationally more efficient. Dynamic behavior of gene regulatory networks averaged over a large number of cells can be modeled by ordinary differential equations. For this scenario, we compute an approximation to the Cramer-Rao lower bound on the mean-square error of estimating reaction rates and demonstrate that, when the number of unknown parameters is small, the proposed particle filter can be nearly optimal.
1. Introduction
Gene regulatory networks (GRN) are systems comprising biomolecular components (genes, mRNA, proteins) that interact with each other and through those interactions determine gene expression levels, that is, determine the rate of gene transcription to mRNA [1–3]. The signals in GRN are carried by molecules. For instance, proteins which enable initiation of the gene transcription to mRNA (so-called transcription factors) can be considered as input signals. They bind to the so-called promoter regions adjacent to the regulated gene and, in doing so, enable an RNA Polymerase to perform the transcription. On the other hand, proteins that are translated from the mRNA can be considered as output signals. Some of the created proteins may act as transcription factors themselves and upregulate or downregulate gene expressions, that is, activate or suppress the transcription process. This creates feedback loops in the network which allow direct or indirect self-regulation. An illustration of a possible segment of a regulatory pathway is shown in Figure 1.

An illustration of a possible segment of a regulatory pathway.
Recent development of DNA and protein microarrays sparked a surge of interest in studying gene regulatory mechanisms. The excitement is due to the capability of the microarrays to conduct simultaneous tests of an entire genome of an organism. By testing a number of biological samples taken over a period of time, one can track the network dynamics. The experimental advances have been accompanied by the theoretical developments in modeling and computational studies of the networks. Combination of these research efforts provides critical information about the functionality of cells and organisms, reveals mechanisms of genetic diseases, enables optimization of diagnostic techniques and therapies, and provides aid in the process of drug discovery.
To enable the analysis of gene regulatory networks, we need accurate yet tractable models capturing their dynamical behavior. The molecular interactions in gene regulatory networks are inherently stochastic. For instance, the number of created proteins is a random variable due to thermal fluctuations in a cell which cause promotors to randomly switch between an active and a repressed state. The fluctuations in the number of proteins are enhanced by the protein degradation which is a stochastic process itself. This, along with several other sources of randomness, call for probabilistic modeling of gene regulatory networks. However, a very detailed description of a network may be difficult to analyze and often requires considerable computational efforts. Hence, several models with varying degrees of accuracy and complexity have been proposed. These models rely on representations via chemical master and chemical Langevin equations [4–6], and ordinary differential equations [7, 8] as well as Bayesian [9, 10] and Boolean [3, 11] networks. Having selected one of the above models, we are interested in finding its structure and parameters that provide the best explanation of the experimental data. This requires further computational studies and opens up questions related to, for example, stability and control of the network. However, inference problems in gene regulatory networks are often challenging, and the difficulty of a problem increases with the complexity of the model and the size of the network.
In this paper, we consider models of GRN based on chemical master equations and study the problem of estimating stochastic rate constants therein. Such models provide the most precise description of the network processes; however, they are also computationally the most demanding. We limit our focus on small-sized networks with a known structure but unknown rate constants. We approximate a chemical master equation by a related chemical Langevin equation [12] and employ a particle filter with the Markov Chain Monte Carlo move step to solve the rate estimation problem. Simulation studies demonstrate that the proposed technique outperforms previously considered methods while being computationally more efficient. Dynamic behavior of gene regulatory networks averaged over a large number of cells can be modeled by ordinary differential equations. For this scenario, we compute an approximation to the Cramer-Rao lower bound on the mean-square error of estimating reaction rates and demonstrate that, when the number of unknown parameters is small, the proposed particle filter can be nearly optimal.
The paper is organized as follows. Section 2 describes the chemical master equation model of a gene regulatory network and its approximation by a chemical Langevin equation. Section 3 presents the particle filtering algorithm for the estimation of the stochastic rate constants and compares its performance with prior work. In Section 4, a deterministic model based on ordinary differential equations is described, and the Cramer-Rao lower bound on the performance of estimating rate constants is computed. Finally, we conclude the paper in Section 5.
2. Models Based on Chemical Master and Chemical Langevin Equations
Consider a GRN comprising  molecular components. The network variables are the numbers of the molecules of each of the
  species; generally, we are interested in the temporal changes of these variables. Denote the number of molecules of the
  network component at time
  by
by  ; for convenience, collect the
  into a vector
  , that is, denote
  . Molecular reactions in a GRN are subject to significant spontaneous fluctuations. Consequently, the numbers of the molecular species
  are inherently stochastic processes. We can model
  as a Markov process with discrete states, where the time evolution of the state probabilities
  is given by the chemical master equation

In (1),  denotes the total number of reactions that are possible within the network (i.e., the number of the so-called reaction channels), and
  is the vector describing change in the number of molecules of each of the
  species due to the reaction in the
  reaction channel (e.g.,
  is the change, either positive or negative, in the number of molecules of the
  network component due to the reaction in the
  channel). Moreover,
  in (1) is the so-called propensity function, that is,
  is the probability that during time interval
  there is a reaction in the
  channel. The propensity function can further be expressed as
  , where
  is the probability that one reaction takes place in
  and
and  denotes the number of possible simultaneous reactions. (The coefficients
  are often referred to as the stochastic rate constants. The function
  counts all possible combinations of individual molecules that may lead to a reaction in the
  channel.) The chemical master equation is often used to simulate the Markov process
  and enable computational studies of GRN. To this end, one may employ various stochastic simulation algorithms, originally proposed by Gillespie [4].
Model (1) provides a very accurate description of the network dynamics [4]. However, since it tracks individual discrete events, it is often cumbersome for practical purposes. For instance, relying on (1) to infer the parameters of the network (i.e., the stochastic rate constants  ) may in principle be possible [13]; however, it is computationally rather intensive to do so. Therefore, simplified network models are desirable. Under certain assumptions (e.g., large
  , small
  ), we may approximate (1) by the chemical Langevin equation,

where  denote zero-mean, unit-variance, independent, identically distributed (iid) Gaussian random variables. By collecting vectors
  into a stoichiometry matrix
  , we can write (2) as

where  denotes an
  -dimensional Wiener process; vector
  is defined as

where

We should point out that while the chemical Langevin equation (2) may be used as a network model for the purpose of parameter estimation, in general it is not sufficiently accurate to provide reliable simulations of the network dynamics. To conduct computational studies of a GRN, we still need to model them using stochastic simulation algorithms.
Let us write the chemical Langevin equation (3) using the notation typically encountered in the literature on stochastic differential equations as

where  denotes the drift,
  is the diffusion, and
 is the vector of (generally unknown) parameters (i.e., the elements of
 are the stochastic rate constants
  ). Our goal is to infer
 from
from  observed at discrete time instances
  , where
  denotes the total number of observations. Assuming zero-mean Gaussian measurement noise with covariance matrix
  , the collected observations have normal distribution of the form

In [14], the authors find the best linear-model fit to the data presumed to be generated by (6), and then infer parameters based on the derived linear model. In [15, 16], the use of statistical mechanics tools for the estimation of the parameters of a network modeled by (6) was considered. In [17, 18], a Markov Chain Monte Carlo (MCMC) algorithm was employed to infer the network parameters. This approach provides sound estimate of the parameters, but it requires a very high computational effort. As an alternative, we propose the use of a particle filter with an MCMC move step. This we describe in the next section.
3. Particle Filter with Markov Chain Monte Carlo Move Step
We consider Bayesian approaches to inferring the unknown parameters in , which is treated as a random vector with a prior
  . Specifically, we rely on particle filtering methods to infer the posterior distribution
  , and then find the estimate
 as the conditional mean of
  . Here
  denotes the set of observations collected in the interval
  , where
  denotes the sampling period and
  denotes the total number of observations (e.g.,
  is the noisy observation collected at time
  ). The desired posterior distribution can be expressed as

where  denotes the set of points of the process
  corresponding to the observations in
  (e.g.,
  ), and
  is given by

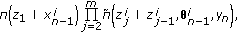
To evaluate (9), one needs to compute the joint density  . In general, however, the transition densities

for the process (6) are not available in a closed form. The stochastic differential equation (6) can be discretized using the Euler-Maruyama scheme as

where  denotes a zero-mean Gaussian distribution with covariance
  , and
, and  denotes the identity matrix. Hence the transition density
  can be approximated by a Gaussian distribution with mean
  and covariance
  . However, the Euler-Maruyama approximation of the transition density is accurate only when
  is small. If the sampling period is not sufficiently small, one can introduce the so-called missing values
  which emulate the diffusion process between
  and
and  (a distinct set of missing values is introduced for each
  ). The number of augmented missing values
  is chosen such that the Euler-Maruyama approximation of the transition density between
  and
and  is accurate, that is,
  is chosen such that
  can be closely approximated by a Gaussian distribution. It is straightforward to show that

where  ,
,  ,
,  ,
,  ,
,  , and
, and  denotes the covariance matrix of the measurement noise.
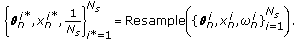
Introduction of the missing values enables propagating (9) by means of a particle filter, where the filter relies on a Gaussian importance density (12). A simple sequential importance resampling (SIR) scheme provides asymptotically consistent estimates, that is, the approximation converges to the true value of the parameters as the number of particles grows. However, the SIR scheme often suffers from sample impoverishment and, therefore, has weak performance. To improve the sample diversity and the performance of the particle filter, we employ the importance sampling scheme with an MCMC move step. Specifically, we use the Metropolis-Hastings algorithm to decide whether a resampled particle will be accepted or not. For implementation details, we refer the reader to the formal algorithm given below.
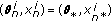
Algorithm 1 (initialization).
Set  . Draw
  from the prior density
  . Assign particle weights
  , for
, for  , and normalize them.
Algorithm 2 (iterations).
For  .
.
-
(i)
For
 , draw missing data
  from an importance density
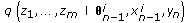 (13)
(13)obtained using the Euler approximation as
 (14)
(14)where
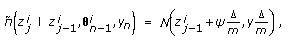 (15)
(15) ,
, 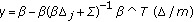 ,
,  ,
,  ,
,  .
.Set
 and update the particle weights as
 (16)
(16) -
(ii)
(Normalization) Normalize the weights
 , and compute
-
(iii)
(Resampling) If
 ,
, (17)
(17) -
(iv)
(Resample move) If resampling is performed in Algorithm 2(
 ), then for
  :
: -
(a)
Draw a candidate
 from a kernel density
  , where
  is the empirical covariance of
  in the previous step and
  is the smoothing parameter.
 -
(b)
Draw missing data
 from an importance density
 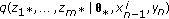 and set
  .
. -
(c)
Calculate the Metropolis-Hastings acceptance rate
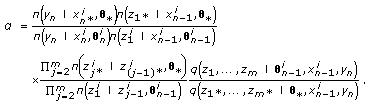 (18)
(18) -
(d)
Set
 with prob.
  .
.
-
(a)
 , draw missing data
  from an importance density


 ,
,  ,
,  ,
,  ,
,  .
. and update the particle weights as
 , and compute
 ,
,
 ), then for
  :
:  from a kernel density
  , where
  is the empirical covariance of
  in the previous step and
  is the smoothing parameter.
 from an importance density
  and set
  .
.
 with prob.
  .
.3.1. Computational Study of a Viral Infection Network
We demonstrate the performance of the proposed algorithm on a viral infection network previously studied in [19, 20]. The network comprises  reaction channels,
R1: 
R2: 
R3: 
R4: 
R4: 
R6: 
where  denotes viral protein molecules and
  denotes synthesized viral cells. Reaction
  is the processes of producing viral cells from the viral
  and protein. Reactions
  and
and  are the transcription and translation process of the viral genes, respectively. Reaction
  models replication of a viral
  template into a viral
  .
.
For the purpose of parameter estimation, we assume that the above network evolves according to (3). However, the network is simulated via the Gillespie's algorithm, with the rate constants set to 
 . We refer to the proposed particle filtering algorithm with MCMC move step as Algorithm 1, and employ it to estimate parameters in this network. The performance of Algorithm 1 is compared to the MCMC method proposed in [18], denoted for convenience as Algorithm 2. Algorithm 1 is performed with
  ,
,  , and the resampling threshold
  . Both algorithms use
  noisy observations of the network states and employ the same initial sample distribution. The log values of the parameters
  are initialized from the uniform distribution
  , and the noise variance is assumed to be known. (Note that even though
  does not belong to the initialization range, the proposed technique accurately infers its value.) Figure 2 compares the mean square-error of estimating the parameters of the viral infection network using Algorithms 1 and 2, obtained by performing
  simulation runs. Clearly, the proposed Algorithm 1 outperforms Algorithm 2, while being roughly
  times faster—the average running time of Algorithm 1 is 1030 seconds, while the average running time of Algorithm 2 is
  seconds (simulations in Matlab).

The mean-square-error performance comparison between Algorithm 1 (particle filter) and Algorithm 2 (MCMC) as a function of the variance of the observation noise σ2 ( ).
).
3.2. Computational Study of Prokaryotic Regulation
In this subsection, we illustrate the performance of the proposed algorithm when employed for estimating reaction rates in a network with  parameters. In particular, we consider estimation of the reaction rates in a GRN model of prokaryotic auto regulation. The system is characterized by the following
  reactions [18]:
R1: 
R2: 
R3: 
R4: 
R5: 
R6: 
R7: 
R8: 
R9: 
R10: 
R11: 
R12: 
Reactions  represent the reversible processes of repressor protein
  binding to
  and
and  . Reactions
  are the transcription and translation processes of genes
  and
and  . Reactions
  represent the degradation process of proteins and mRNAs in the system. The state vector
  collects the numbers of components
  ,
,  ,
,  ,
,  ,
,  , and
, and  , and hence it is a
  -dimensional state vector.
Similar to the study of the viral infection network in the previous subsection, to infer the reaction rates, we assume that the above network evolves according to (3). However, the network is simulated via Gillespie's algorithm. In particular, we generate  noisy observations
  ,
,  , where the measurement noise is Gaussian with
  (i.e., the noise variance matrix is
  ). The particle filter (Algorithm 1) is performed with
  ,
,  , and the resampling threshold
  . The log values of the parameters
  are initialized from the uniform distribution
  .
.
The reaction rates are inferred as the mean values of the distributions estimated by the particle filter. True values of the parameters and their estimates are shown in Table 1. When Algorithm 1 is performed with  and
and  MCMC iterations with a
  burn-in period, the runtime of Algorithms 1 and 2 is comparable but the former is significantly more precise than the latter. In order to achieve similar performance, Algorithm 2 requires significantly higher complexity (
 MCMC iterations with a
  burn-in period).
 MCMC iterations, and Algorithm 2(ii) employs
  iterations.
4. A Deterministic Model of Gene Regulatory Networks
In reaction systems, where both the number of molecules and the system volume are large, due to averaging, the system dynamics can be described by a deterministic model. The same applies to modeling the dynamic behavior of a gene regulatory network averaged over a large number of cells. A deterministic model based on ordinary differential equations (ODE) is of the form [12, 21]

where  comprises real-valued and deterministic variables. On the other hand, the observation process is assumed to be corrupted by a Gaussian noise and hence the measurements are given by

Typically, observations are collected at discrete time instances  , where
  denotes the total number of observations. Therefore,

where  .
.
To facilitate a simple estimation procedure, (19) can be discretized as

It was pointed out in [22] that, under appropriate conditions, discretization induces smaller error than the measurement noise. In general, we assume that  . To estimate the unknown parameters
  in (22), we employ the particle filtering with MCMC step (i.e., Algorithm 1 in Section 3). Since the state transitions in model (22) are deterministic (and not random, as in (3)), some of the steps of Algorithm 2 are simplified. In particular, steps (i) and (iv.b) of Algorithm 2 can be simplified in the following way: for each particle, instead of drawing a series of missing data
  from an importance distribution, we deterministically generate them from the previous state
  as
as

and  . The weights updating equation becomes

Moreover, in Algorithm 2 (iv.c), the Metropolis-Hastings acceptance rate is simplified to

Other steps of Algorithm 1 remain unchanged.
4.1. Cramer-Rao Lower Bound on the Mean-Square Error of Estimating Reaction Rates
Mean-square error of any estimation procedure can be bounded below by the Cramer-Rao lower bound (CRLB) [23]. In this section, we compute the CRLB on the estimation of reaction rates in the network described by (19) and (21). Collect the observations  ,
,  , into a vector

The Cramer-Rao lower bound on the minimum mean-square error of estimating a parameter  , given
  , is computed as

where the Fisher information matrix  is given by the negative of the expected value of the Hessian matrix of

From (21), it follows that  is a Gaussian vector with mean
  and covariance
  . Thus we have

Following similar derivations in [24], we obtain that

Since  is known,
  , and thus

Therefore, only  is needed to evaluate
  . From (20), it follows that
  . Moreover, since
  , we can write

where  . Taking derivatives of both side of (22), we obtain

where  denotes the
  matrix with all zero entries except the
  entry which is equal to
  .
.
Notice that  are functions of
  and
and  ; therefore, we can recursively calculate
  from
from  and
and  . The value of
  s can be obtained by numerically solving (19) (e.g., using Mathematica). This enables computation of
  and, therefore, the desired CRLB. (Note that the CRLB computed in this section assumes the discretized model (22); as
  , it approaches the true bound on estimating
  in (19)).
4.2. Computational Study of a Viral Infection Network
We illustrate the performance of the particle filter and compare it with the computed CRLB for the case of the viral infection network studied in Section 3.1. We assume that the network evolves according to the ODE model described in this section. The rate constants associated with reactions are, as before,  . We apply the modified version of Algorithm 1 described in this section to estimate the rate constants and evaluate the corresponding CRLB. Note that, in this example, the stoichiometry matrix is given by

and hence

Figure 3 shows the mean and standard error of inferring the reaction rates using the proposed estimator, shown as a function of the variance of the observation noise (discretization time:  , the number of particles:
  , the noise variance:
  ). Several of the parameters are estimated very accurately (e.g.,
  ,
,  ), while others have relatively large mean-square-error (e.g.,
  ,
,  ). Figure 4 compares the estimation mean-square error with the corresponding CRLB, plotted as a function of the number of measurements
  used for the estimation. As indicated in Figure 4, the estimator performs close to the CRLB for several of the parameters (e.g.,
  ,
,  ), while for other parameters there is room for improvement.

The mean and standard error of the particle filter estimator for the inference of reaction rates in a viral infection network, shown as a function of the variance of the observation noise (the number of particles used is ; performance is averaged over simulation runs).

The CRLB and the average mean-square error of the particle filtering algorithm (the number of particles , noise covariance matrix Σ = I).
5. Conclusions
In this paper, we studied the problem of estimating reaction rates in a gene regulatory network modeled by a chemical Langevin equation, that is, a high-dimensional stochastic differential equation. We proposed a solution which employs a particle filtering algorithm with Markov Chain Monte Carlo move step. Extensive simulation studies demonstrated that the proposed technique requires less computational complexity to achieve performance comparable to previously proposed methods. Moreover, we considered the deterministic description of the average network dynamics based on an ordinary differential equation model. For this scenario, we computed an approximate Cramer-Rao lower bound on the mean-square error of the estimation and demonstrated that, for some of the parameters, the proposed particle filter can be nearly optimal. The computed CRLB is indicative of the number of data points (i.e., the number of experiments) required to achieve a desired accuracy of inferring reaction rates. Further studies are needed to enable near-CRLB performance in the scenario of estimating a large number of unknown parameters.
References
Loomis WF, Sternberg PW: Genetic networks. Science 1995, 269(5224):649. 10.1126/science.7624792
Thieffry D: From global expression data to gene networks. BioEssays 1999, 21(11):895-899. 10.1002/(SICI)1521-1878(199911)21:11<895::AID-BIES1>3.0.CO;2-F
Albert R: Boolean Modeling of Genetic Regulatory Networks. In Complex Networks. Springer, New York, NY, USA; 2004.
Gillespie DT: Exact stochastic simulation of coupled chemical reactions. Journal of Physical Chemistry 1977, 81(25):2340-2361. 10.1021/j100540a008
Gillespie DT: A rigorous derivation of the chemical master equation. Physica A 1992, 188(1–3):404-425.
McAdams HH, Arkin A: Stochastic mechanisms in gene expression. Proceedings of the National Academy of Sciences of the United States of America 1997, 94(3):814-819. 10.1073/pnas.94.3.814
Chen T, He HL, Church GM: Modeling gene expression with differential equations. Proceedings of Pacific Symposium on Biocomputing, 1999 29-40.
Grognard F, de Jong H, Gouze J-L: Piecewise-Linear Models of Genetic Regulatory Networks: Theory and Examples, Lecture Notes in Control and Information Sciences (LNCIS). Springer, New York, NY, USA; 2007.
Friedman N, Linial M, Nachman I, Pe'er D: Using Bayesian networks to analyze expression data. Journal of Computational Biology 2000, 7(3-4):601-620. 10.1089/106652700750050961
Heckerman D: A tutorial on learning with Bayesian networks. In Learning in Graphical Models. Kluwer Academic Publishers, Dordrecht, The Netherlands; 1998.
Kauffman SA: Metabolic stability and epigenesis in randomly constructed genetic nets. Journal of Theoretical Biology 1969, 22(3):437-467. 10.1016/0022-5193(69)90015-0
Cai X, Wang X: Stochastic modeling and simulation of gene networks. IEEE Signal Processing Magazine 2007, 24(1):27-36.
Boys RJ, Wilkinson DJ, Kirkwood TBL: Bayesian inference for a discretely observed stochastic kinetic model. Statistics and Computing 2008, 18(2):125-135. 10.1007/s11222-007-9043-x
Chen K-C, Wang T-Y, Tseng H-H, Huang C-YF, Kao C-Y: A stochastic differential equation model for quantifying transcriptional regulatory network in Saccharomyces cerevisiae. Bioinformatics 2005, 21(12):2883-2890. 10.1093/bioinformatics/bti415
Berg J: Dynamics of gene expression and the regulatory inference problem. Europhysics Letters 2008., 82(2):
Benecke A: Gene regulatory network inference using out of equilibrium statistical mechanics. HFSP Journal 2008, 2(4):183-188. 10.2976/1.2957743
Golightly A, Wilkinson DJ: Bayesian sequential inference for stochastic kinetic biochemical network models. Journal of Computational Biology 2006, 13(3):838-851. 10.1089/cmb.2006.13.838
Golightly A: Bayesian inference for nonlinear multivariate diffusion processes, Ph.D. thesis. Newcastle University; 2006.
Srivastava R, You L, Summers J, Yin J: Stochastic vs. deterministic modeling of intracellular viral kinetics. Journal of Theoretical Biology 2002, 218(3):309-321. 10.1006/jtbi.2002.3078
Goutsias J: Quasiequilibrium approximation of fast reaction kinetics in stochastic biochemical systems. Journal of Chemical Physics 2005, 122(18):-15.
Gillespie DT: Chemical Langevin equation. Journal of Chemical Physics 2000, 113(1):297-306. 10.1063/1.481811
Li Z, Osborne MR, Prvan T: Parameter estimation of ordinary differential equations. IMA Journal of Numerical Analysis 2005, 25(2):264-285. 10.1093/imanum/drh016
Cramer H: Mathematical Models of Statistics. Princeton University Press, Princeton, NJ, USA; 1946.
Vikalo H, Hassibi B, Hassibi A: Limits of performance of quantitative polymerase chain reaction systems. IEEE Transactions on Information Theory 2010, 56(2):688-695.
Acknowledgment
This work was supported in part by the National Science Foundation under Grant no. CCF-0845730.
Author information
Authors and Affiliations
Corresponding author
Rights and permissions
Open Access This article is distributed under the terms of the Creative Commons Attribution 2.0 International License (https://creativecommons.org/licenses/by/2.0), which permits unrestricted use, distribution, and reproduction in any medium, provided the original work is properly cited.
About this article
Cite this article
Shen, X., Vikalo, H. Inferring Parameters of Gene Regulatory Networks via Particle Filtering. EURASIP J. Adv. Signal Process. 2010, 204612 (2010). https://doi.org/10.1155/2010/204612
Received:
Revised:
Accepted:
Published:
DOI: https://doi.org/10.1155/2010/204612