- Research Article
- Open access
- Published:
PIC Detector for Piano Chords
EURASIP Journal on Advances in Signal Processing volume 2010, Article number: 179367 (2010)
Abstract
In this paper, a piano chords detector based on parallel interference cancellation (PIC) is presented. The proposed system makes use of the novel idea of modeling a segment of music as a third generation mobile communications signal, specifically, as a CDMA (Code Division Multiple Access) signal. The proposed model considers each piano note as a CDMA user in which the spreading code is replaced by a representative note pattern. The lack of orthogonality between the note patterns will make necessary to design a specific thresholding matrix to decide whether the PIC outputs correspond to the actual notes composing the chord or not. An additional stage that performs an octave test and a fifth test has been included that improves the error rate in the detection of these intervals that are specially difficult to detect. The proposed system attains very good results in both the detection of the notes that compose a chord and the estimation of the polyphony number.
1. Introduction
In this paper, we deal with a main stage of automatic music transcription systems [1]. We are refering to the detection of the notes that sound simultaneously in each of the temporal segments in which the musical piece can be divided. More precisely, we deal with the multiple fundamental frequency ( ) estimation problem in audio signals composed of piano chords. Therefore, the objective in this paper is to robustly determine the notes that sound simultaneously in each of the chords of a piano piece.
The approach employed in this paper is rather different from other proposals that can be found in the literature [1, 2]. In the paper by Goto [3], a multiple  estimation method based on a MAP approach to detect melody and bass lines is described. In the contribution by Klapuri [4, 5] a multiple
  estimation method based on the iterative estimation of harmonic amplitudes and cancellation is presented. Kashino et al. [6, 7] propose a Bayesian approach to estimate notes and chords. Dixon [8] uses heuristics in the context of the Short Time Fourier Transform (STFT) to find peaks in the power spectrum to define musical notes; also tracking the detected peaks in consecutive audio segments is considered. In the paper by Tolonand and Karjalainen [9], a multipitch analysis model for audio and speech signals is proposed with some basis on the human auditory model. Vincent and Plumbley [10] propose an
  extraction technique based on Bayesian harmonic models. Marolt [11, 12] uses a partial tracking technique based on a combination of an auditory model and adaptive oscillator networks followed by a time-delay neural network to perform automatic transcription of polyphonic piano music.
In this paper, we consider a different point of view. The audio signal to be analyzed will be considered to have certain similarities with the communications signal of a 3G mobile communications system. In this system, the communications signal is a code division multiple access (CDMA) signal [13]. This means that multiple signals from different users are transmitted simultaneously after a spreading process [14] that makes them approximately orthogonal signals. So, our model will consider each piano note as a CDMA user. We consider that the sinusoids with the frequencies of the partials of each note define a signal composed of approximately orthogonal components. In this signal, some of the sinusoidal components of the model, the effect of windowing, the time-variant nature of the music signal, and other effects can be included in the concepts of noise and interference, that makes the different notes loose the property of orthogonality. So, each note will add interference (non orthogonal components) to other notes in a music signal in which several notes are simultaneously played. Then, the detection of the different notes played simultaneously can be considered as the problem of simultaneously removing the interference from the different notes and, then, deciding the notes played. The process is similar to the way in which a PIC receiver removes the interference from the multiple users to perform the symbol detection. In our context, the spreading codes will be the spectral patterns of the different notes. These patterns will include both the inherent characteristics of the piano and the style of the interpretation.
Turning back to the communications framework, it is clear that the most favorable and simplest case in CDMA systems is the one in which the spreading codes are orthogonal; that is, the cross-correlation between them is zero. In this case, it is known that the optimum detector is the conventional correlator. Then, the receiver can be easily implemented as a bank of filters adapted to the users' spreading codes [15]. Nevertheless, real CDMA systems do not fulfill the orthogonality condition; so the design of advanced detectors, like the PIC receiver, is required to cope with the interference due to the lack of orthogonality and to the multiuser access. In the context of musical signals, regarding the problem of detection of the notes that compose a musical chord, the orthogonality condition between the spectral patterns of the different notes cannot be achieved. This is due to the harmonic relations that exist between the notes of the equal-tempered musical scale typically used in Western music, specially between octaves and fifths (despite inharmonicity and stretched tuning [16]).
In order to perform the detection of the notes that sound in a certain segment or window of a musical audio signal, we have considered the CDMA detection technique called Parallel Interference Cancellation (PIC). We have selected PIC detection among other techniques [14, 15, 17] because it has been observed that PIC detection obtains very good performance in different CDMA system configurations [18] and it can be reasonably adapted to our problem. The PIC detector is aimed to simultaneously remove, for each user, the interference coming from the remaining users of the system. In the specific case of the music signal, regarding each piano note, the interference (parts or components of a note that are not orthogonal to other notes) caused by the rest of the notes should be simultaneously removed to allow the simultaneous detection of the different notes. A brief overview of the PIC detector for piano chords will be given in Section 2.
The paper is organized as follows. Section 2 will present a general view of the structure of the proposed PIC detector for piano chords. Section 3 will present the music signal model employed and the preprocessing techniques required, paying special attention to the similarities to CDMA signals. Section 3.1 will describe the process of estimation of the note patterns required to perform interference cancellation and detection and Section 3.2 will show the preprocessing tasks to be applied to the input signals before the interference cancellation process. Section 4 will describe in detail the structure of the interference cancellation stage of the parallel interference cancellation (PIC) detector adapted to the piano signal. Next, Section 5 will propose a method to finally decide the notes played using the outputs of the PIC. This section will cover not only the direct detection of notes but also specific tests to properly deal with their octaves and fifths. Section 6 will present some results and comparisons of the performance of the detection system. Finally, Section 7 will draw some conclusions.
2. Overview of the PIC Detector for Piano Chords
In this section, a general overview of the structure of a PIC Detector for piano chords is given. Figure 1 shows a general PIC structure in which the interference cancellation stage is the heart of the detector. The detector is defined upon three different stages.

General structure of the PIC detector for piano chords.
The first stage (Preprocessing) obtains a representation of the chord ( ) to be analyzed in the frequency domain so that its representation matches the signal model used in the system. Then, the preprocessed signal,
  , passes through the parallel interference cancellation (PIC) block. This stage obtains an output for each of the notes of any piano (
 notes for a standard piano). These values are related to the probability of having played each of the notes of the piano. To perform the parallel detection of interference, the note patterns (
 ) estimated from the musical signal model, taken as spreading codes, will be used. Finally, making use of the outputs of the PIC stage,
  , it must be decided which are the notes that are actually present in the chord. This is the task of the final decision stage (Note Decision). This stage performs the decision using previously precomputed generic thresholds,
  , together with a method of discrimination between actually played notes and octaves and fifths.
3. Music Signal Model
In this section, the music signal model considered to allow interference cancellation is presented. Also, marked similarities between the CDMA mobile communications signal and the audio signals are outlined. Recall that the music signals that will be handled by the proposed detector will be piano chords, that is, waveforms that contain the contribution of one or more notes that sound simultaneously. Consider a piece (window) of the waveform of the music audio signal. This signal, say  , can be expressed, in general, as follows:

where  , is the number of all the notes that can sound in the window (88 notes for a standard piano),
  , represents the global amplitude of the
  th note that may sound in the chord,
  , indicates whether the note sounds (the note was played),
  , or not,
  ,
,  , stands for the representative waveform of the
  th note in the chord, with normalized energy, and
  , represents additive white Gaussian noise (AWGN) with variance
  .
.
More details on this model will be given shortly, but before that, let's turn our sight to the mobile communications context. In such context, a certain window of a CDMA signal model can be expressed as follows [18]:

where  , is the number of simultaneous active users,
  , is the amplitude of the
  th user's signal,
  , is the bit transmitted by user
  ,
,  , represents the spreading code assigned to user
  with energy normalized to one, and
  , represents AWGN with variance
  .
.
A comparison of (1) and (2) reveals that they share the same formulation, but also some differences must be observed. In (2), the bits transmitted by user  ,
,  , are represented by ±1, while in (1) the values that
  may take are 1 or 0. Moreover, at the sight of the two equations, the definition of
  takes into account all the possible notes that can be played, while
  , in (2), only includes the active users in the communications system (note that the number of possible user codes can be very high). Then, the problem of the detection of the notes played in a window of the available waveform, becomes the problem of deciding if
  is 0 or 1 in (1), while the receiver of the communication system must detect the bits that have been transmitted by each active user, that is, to decide if
  is 1 or −1. In spite of these differences, the similarity between (1) and (2) is enough to encourage us to consider the adaptation of advanced communication receivers to the detection of the notes in our musical context.
A main requirement of any CDMA detector is the following: the detector needs to know the spreading codes of the users,  . In our context, according to (1), the partial waveforms of the notes,
  , are required, these will be called time patterns of the notes. But the same formulation is also valid in the frequency domain, then, the discrete power spectrum of
  , can be expressed as follows:

where  is the
  th bin of the power spectrum,
  , (
, ( ), of
), of  , and
, and  represents the power spectrum of the additive noise
  .
.
It is clear that (3) is also similar to (2), in which the CDMA signal model is shown. If we consider a type of CDMA receiver adapted to our context, it will require to know the power spectrum,  , of each of the notes that can sound in order to be able to perform the detection of the notes. These functions will be used to define the spectral patterns of the notes that will become the note patterns.
The audio signal model in the frequency domain will be used to design our system and the spectral patterns will be selected to represent the different notes just like spreading codes represent different users. The procedure to define the note patterns and the preprocessing stage required at the input of our PIC detector are described in the next subsections.
3.1. Determination of Note Patterns
In order to detect each note correctly, the detector needs to know the note patterns just like any CDMA detector needs to know the spreading codes of the users [19]. Also, these patterns should be as independent as possible of the piano and of the technique employed in the performance. Since the chord detection system will work in the frequency domain, spectral patterns of the notes will be used to play the role of the CDMA spreading codes in communication systems.
The representative spectral pattern of each note is obtained as the average power spectrum of 27 different waveforms of the possible performances in which each note can be played: three different playing techniques (Normal, Staccato and Pedal) in three different dynamics (Forte, Mezzo and Piano) and three different pianos. These samples are taken from the RWC data base [20], in which the audio signals are sampled at a frequency rate of 44.1 kHz and quantized with 16 bits. The length of the analysis windows,  , is also the number of bins of the power spectrum and it ranges between 214 and 217, which results in analysis windows of duration between 371 ms and 2.97 s. These window lengths have been found adequate for a polyphonic music transcription system, showing a good compromise between time and frequency resolution [21]. The analysis windows are obtained applying a rectangular windowing function (simple truncation) to the signal waveform after the onset of the sound [22]. Note patterns are normalized to have unit energy so that they can be easily used in the interference cancellation stage (Section 4). With all this, each note pattern is a
  -dimensional vector defined as:

where  , is the vector that contains the
  points of the power spectrum of the
  -st performance of the
  -st note of the piano,
  , is the number of waveforms considered for each note (27 different performances per note),
  , is the normalization constant, defined as

In this way, general note patterns that take into account the positions of the partials and their relative power are obtained. These patterns can be used to detect the notes played in an analysis window regardless the piano employed and the interpretation technique. The set of patterns calculated for all piano notes will be denoted by  :
:

This set of patterns will be used in the PIC detector as it will be described in Section 4.
The required signal preprocessing stage according to this audio signal model, is presented in the next subsection.
3.2. Preprocessing of Analysis Windows
Taking into account that the interference cancellation stage will perform in the frequency domain using the defined spectral note patterns, the detection system needs a stage to extract a representation of the signal that will be usable in the cancellation stage. This is the task of the preprocessing block in Figure 1.
The preprocessing stage obtains the discrete power spectrum of the windowed waveform under analysis (3) with length  , where
  ranges between 214 and 217, as in the process of determination of the note patterns (the windowing function used in this stage is the same that is used for the determination of the note patterns). The samples of the power spectrum are stored in the vector:

This vector constitutes the input to the parallel interference cancellation stage.
4. Parallel Interference Cancellation (PIC)
Once the note patterns are defined and stored in the pattern matrix  , and after the description of the preprocessing stage, the core of the detector, will be described.
A general description of the structure and behavior of PIC structures in communication systems together with comments on certain issues regarding to the cancellation policy, the receiver power of different users (notes in our context) and the number of cancellation stages can be found in [17]. Now, we will draw a description of the system specifically adapted to our context.
Figure 2 depicts the general structure of a linear multistage PIC detector, with  stages, for the detection of
  -notes. Note that in our case
  . This choice means that we will consider all the notes that can be played in a standard piano (88 notes from A0 to C8), unlike other authors that often do not consider the lowest and the highest octaves of the piano [4] (in [4] the range of notes detected is from E1 to C7). A general description of the behavior follows. Each note that sounds in the window under analysis (
 ), (
), ( after preprocessing) introduces disturbance (interference) to the process of detection of each of the remaining
  notes that may sound at the same time. Then, it should be possible to create replicas of the
  notes detected to be simultaneously subtracted from the input signal (
 ) to remove their contribution (disturbance or interference) and to allow better performance of the note detection process at the next stage. This process is performed using the scheme in Figure 3. This figure will be described in detail later.

General structure of the PIC detector.

Stage m of the PIC detector for note l.
Note that if the initial detections are correct, then the replicas reconstructed could be perfect. This scheme would offer complete interference cancellation in one stage. On the other hand, if a note is detected, but it was not really sounding, a replica, created using the note patterns, subtracted from the input signal, adds additional disturbance (interference) to the process of detection of other notes. Also, any mismatch between a note pattern and the preprocessed waveform of that note may introduce interference into the detection process of other notes. This is a main reason why a more conservative procedure, in which interference is partially removed at successive interference cancellation stages, was proposed [23] and selected to deal with our problem (Figure 3). In this structure, as the stages progress, the detections should be more reliable and the cancellation process should be more accurate. Also, the unavoidable difference between the note patterns and the preprocessed note contributions to the chords discourages us from attempting to perform total interference cancellation.
Specifically, a multistage partial PIC detector structure has been chosen [17, 23, 24]. In this detector, the parameter  , see Figures 2 and 3, represents the maximum amount of interference due to each note that will be canceled. In the context of digital communications systems, this strategy attains good performance with a small number of interference cancellation stages (between 3 and 7) when the weights of each stage,
  , are correctly chosen [18].
The interference cancellation structure, in our case, is analogous to the one presented in [18, 23]. Note that at the PIC front-end, an initial detection of the notes is performed using a bank of correlators. For each note  , the centered correlation between the preprocessed input signal,
  , and the corresponding note pattern,
  , is calculated,
  (see Figure 2). The value obtained is used as input to the first cancellation stage (Figure 2).
Now, the proper cancellation process starts. At each stage of the multistage PIC detector, for each note  , the process shown in Figure 3 is performed. In this figure, the following notation is employed.
-
(i)
Thick lines represent vectors of length
 , the length of the power spectrum considered.
 -
(ii)
Thin lines represent scalar values.
-
(iii)
 is the pattern of the
  th note of the piano, calculated using (4).
 -
(iv)
 , where
  is the number of piano notes considered (88 notes in our case).
 -
(v)
 is the cancellation parameter for stage
  . This parameter controls the amount of cancellation done at each stage. Usually, this parameter grows as the number of stage increases [25]. The reason for this choice is based on the expected improvement of the decision statistics obtained after each PIC stage as the signal goes through the interference cancellation system. Under this assumption, interference cancellation can be performed with lesser error in the successive stages.
 -
(vi)
 is the decision statistic obtained for note
  after the cancellation stage
  .
. -
(vii)
 calculates the centered correlation between the input signal and the note pattern
  .
. -
(viii)
 represents the linear regeneration made at stage
  of the possibly played note
  .
.  is given by
 (8)
(8)
 , the length of the power spectrum considered.
 is the pattern of the
  th note of the piano, calculated using (4).
 , where
  is the number of piano notes considered (88 notes in our case).
 is the cancellation parameter for stage
  . This parameter controls the amount of cancellation done at each stage. Usually, this parameter grows as the number of stage increases [
 is the decision statistic obtained for note
  after the cancellation stage
  .
. calculates the centered correlation between the input signal and the note pattern
  .
. represents the linear regeneration made at stage
  of the possibly played note
  .
.  is given by
As it can be observed in Figure 3, the output at each stage  for each note
  is obtained by removing, from the preprocessed input
  , the regeneration of the remaining (
 ) notes of the piano weighted by the cancellation parameter
  . The larger
  , the larger is the interference canceled.
Errors in the detections make the system add additional interference, instead of removing interference. The interference added in this case grows with the cancellation parameter. Therefore, the choice of cancellation weights is essential for the proper performance of the PIC. In Section 6, a comparison between different sets of weights and different number of stages shows the importance of the choice of these parameters.
The output of the PIC for the detection of each note will be stored in the vector  (see Figures 1 and 2). This vector will contain the
  decision statistics of the notes of the piano:

This vector must be analyzed to decide which notes were played.
5. Played Note Decision
Making use of the PIC outputs, the system must decide which notes were played in the window under analysis. Ideally, the elements in  that correspond to the notes that were actually played, should be positive values and zero elsewhere. Unfortunately, this does not happen because of the windowing, the way in which the note patterns are defined, noise and because of the equal-tempered music scale, used in Western music. Note that assuming ideal harmonicity, the equal-tempered scale sets many nonorthogonal frequency relationships between different notes, being the most outstanding of them the octave and perfect fifth [21]. All these issues make appear significant values at the positions of the decision statistics obtained by the PIC for notes that were not actually played. The task of the Note Decision stage is to deal with this problem to make a decision on the notes played.
In Figure 4, the structure of the Note Decision stage is shown. This stage consists of two distinct blocks: Energy Thresholding and Harmonic Tests.

Structure of the Note Decision stage.
5.1. Energy Thresholding
The objective of this block is to identify the notes that definitely were not played. This initial decision is based on the comparison of the estimated energy of the contribution of each possible note to the (preprocessed) input signal  , versus a threshold. In order to do this, all the decision statistics in
  are compared with a threshold.
Now, the thresholds must be defined. In order to properly define them, we must first notice that before the normalization (see (5)), the note patterns of the different notes do not have the same energy. The energy of the contribution of each note to the input signal will show the same behavior. So, the thresholds must take into account this feature. To this end, we decided to define thresholds for groups of notes clustered according to the mean energy of the samples available in our databases.
Let  denote the number of groups or clusters. We will define a matrix of thresholds,
  , for all the piano notes clustered in
  groups. Note that these thresholds will be valid for all the notes regardless of the piano and the interpretation, just like the note patterns previously defined.
A detailed description of the process of creation of the groups of notes, the definition of the thresholds and how these thresholds are employed is now given:
Creation of the Clusters of Notes
First, we have to define the groups of notes that we will consider according to their expected mean energy. Recall that we refer to the selected representation of the notes in our system, not to the note waveforms. The mean energy of each note is calculated from the recorded samples of pianos 1 to 3 of the Musical Instrument Data Base RWC-MDB-1-2001-W01 [20]. We calculate the energy of each piano note played with different performance techniques and, then, the mean is obtained. Second, the notes are ordered according to their energy, in descendant order. The largest mean energy,  , is selected and the following energy interval is defined:
  ,
, (the coefficient 0.66 has been experimentally obtained). The notes whose mean energy is in this interval compose the first group of notes. Then, these steps are recursively performed with the remaining notes until all the notes are grouped. After the completion of this process,
  groups of notes are obtained.
Definition of Thresholds
We consider two types of threshold: one type of threshold for notes in the same group  (autothreshold, represented as
  ) and the other one for the notes in the other groups
  , where the group
  has more energy than group
  (it will be denoted crossthreshold and it will be represented as
  ).
).
Autothresholds,  , are calculated as follows: the notes with the largest and the lowest energy in the group
  are selected (let
  and
and  represent the indexes of these notes in the group
  , resp.) and a composed signal formed summing the patterns of these notes (
 and
and  resp.) weighted by the square root of their corresponding energy is obtained:

where  was defined in (5).
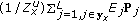
Then, this composed signal passes through the PIC detector (Figure 2). The vector obtained at the output of the PIC,  , is normalized by the value of its largest element. Then, autothresholds are defined by the element in the normalized vector
  that corresponds to the note with the lowest energy.
Crossthresholds,  , are calculated in a similar way as autothresholds but different notes are selected as reference. Specifically, the note with the largest energy in the group
  (
( ) and the note with the lowest energy in the group
  are selected. Then, the composed signal is defined as follows:

This signal,  , passes through the PIC structure and, then, the threshold is defined as in the previous case.
Construction of the Matrix of Thresholds
All the thresholds defined are stored in a matrix with the following structure:

where each column represents all the thresholds found for a dominant group,  .
.
Usage of the Matrix of Thresholds
The group  , that contains the note with the largest value at the output of a PIC stage,
  , is selected. Then, the corresponding column of the matrix
  ,
,  , is used for thresholding.
Once the threshold column is selected, the elements in  under the corresponding thresholds are removed and the final decisions will be taken with the remaining elements.
The output of the energy thresholding block is denoted  . This vector contains all the notes that were possibly sounding in the window under analysis. However, additional tests, that take into account harmonic relations among the notes, must be performed to avoid false positives.
5.2. Harmonic Tests
The last block of the note decision stage includes some harmonic tests to perform the final decision. One of the problems in polyphonic detection is the detection of the octave and perfect fifth since many errors occur due to either missing notes or, especially, to the appearance of false positives [26, 27]. This is due to the overlapping between harmonic partials of different sounds. Assuming ideal harmonicity, it is known that harmonic partials of two sounds coincide if and only if the fundamental frequencies of the two sounds are in rational number relations [28, 29]. When the harmonicity is not ideal, the overlapping continues since the partials of the notes may exhibit appreciable bandwidth. On the other hand, an important principle in Western music is that simple harmonic relationships are favored over dissonant ones in order to make the sounds blend better [21]. This is the case of octaves and fifths. These intervals are the ones whose harmonious relationships are the simplest (2 : 1 and 3 : 2) and these are also the two most frequent intervals in Western music [30].
The objective of the harmonic tests is to decide if the possibly played notes in  were actually played or if those are due to perfect octaves or perfect fifths. Finally, it is worth mentioning that this stage includes the estimation of the polyphony number in each chord.
In Figure 5, the general structure of the final stage is presented. The notation used in the figure is as follows.
-
(i)
 is the vector that contains all the possibly played notes. It was obtained after the energy thresholding stage.
 -
(ii)
 is the vector that contains the mean energy of the 88 piano notes.
 -
(iii)
 is the note pattern matrix.
 -
(iv)
 is the set of notes that do not pass the octave test.
 -
(v)
 is obtained removing from
  the notes in
  .
. -
(vi)
 is the set of notes that do not pass the fifth test.
 -
(vii)
 is the final vector of notes detected.
 is the vector that contains all the possibly played notes. It was obtained after the energy thresholding stage.
 is the vector that contains the mean energy of the 88 piano notes.
 is the note pattern matrix.
 is the set of notes that do not pass the octave test.
 is obtained removing from
  the notes in
  .
. is the set of notes that do not pass the fifth test.
 is the final vector of notes detected.
Structure of the harmonic tests.
As it can be seen in Figure 5, the decision process is as follows: first, all the possible notes with octave relations are considered and it is checked whether they are actually played notes. The notes that do not pass this test,  , are removed from
  to define
  . Then, all the possible notes with fifth relation in
  , are considered and, then, it is checked if they are really played notes. Again, the notes that do not pass the test,
  , are removed from
  to give a vector of notes detected (
 ).
).
5.2.1. Octave/Fifth Test
The octave and the fifth relation tests are similar, the only difference among them is the relation between the notes involved and the thresholds. Figure 6 shows the block diagram employed in the octave/fifth tests.

Block diagram of the octave/fifth test.
The notation used in Figure 6 is described now.
-
(i)
 is the vector that contains all the possibly played notes.
 -
(ii)
 is the vector that contains a subset of notes from
  or
or  that fulfill the criteria of octave or fifth relation.
 -
(iii)
 is the signal composed with the patterns of the notes to check (
 ) weighted by their corresponding energy (
 ), in order to properly cope with low- and high-energy notes, and normalized to unit energy using the normalization constant:
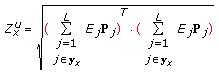 (13)
(13) -
(iv)
 is the threshold vector for the octave/fifth-related notes.
 -
(v)
 is the set of notes that do not pass the octave (
 )/fifth (
 ) tests.
 is the vector that contains all the possibly played notes.
 is the vector that contains a subset of notes from
  or
or  that fulfill the criteria of octave or fifth relation.
 is the signal composed with the patterns of the notes to check (
 ) weighted by their corresponding energy (
 ), in order to properly cope with low- and high-energy notes, and normalized to unit energy using the normalization constant:
 is the threshold vector for the octave/fifth-related notes.
 is the set of notes that do not pass the octave (
 )/fifth (
 ) tests.
The operations performed in these tests are similar to those in the process of estimation of the thresholds  . The description of this process follows: a synthetic signal is composed with the patterns of the notes weighted by their corresponding energy. The synthetic signal is normalized to have unit energy. The composed signal passes through the PIC detector and the outputs are normalized by the maximum value of the outputs. Then, the output of the PIC, that correspond to the notes under test, are used as new thresholds for these notes. If a decision statistic of a note does not pass the new threshold, then the note will be removed from the set of possibly played notes since the value of the decision statistic found at the output of the PIC stage is considered to be due to some octave/fifth relation.
6. Results
The evaluation of the performance of the PIC detector for piano chords described in this paper and the comparison of the result versus a selected technique in [4] have been done using samples taken from different sources.
-
(i)
Independent note samples: these samples correspond to pianos 1 to 3 of the Musical Instrument Data Base RWC-MDB-1-2001-W01 [20] and home-made recordings of two different pianos (Yamaha and Kawai).
-
(ii)
Chord recordings: these samples are home made recordings of the two different pianos (Yamaha and Kawai).
The total number of samples available was over 4200. Note that the patterns are defined using a database which is different from the one used in the evaluation. The pianos used for the chord recordings are a Yamaha Clavinova CLP-130 and a Kawai CA91 played in a concert room.
The chords used to validate the system correspond, to the real chords frequently used in Western music. All the chords have been recorded in all the piano octaves and with different octave separations between the notes that constitute the chord. The recorded chords, as a function of the polyphony number, are as follows:
-
(i)
chords of two notes: intervals of second, third, fourth, fifth and octaves as well as their extension with one, two, three and four octaves,
-
(ii)
chords of three notes: perfect major and perfect minor chords with different order of notes,
-
(iii)
chords of four notes: perfect major and perfect minor chords with duplication of their fundamental or their fifth, as well as, major 7th and minor 7th chords,
-
(iv)
chords of five notes: perfect major and perfect minor chords with duplication of their fundamental and their fifth, as well as major 7th and minor 7th chords with duplication of their fundamental,
-
(v)
chords of six notes: perfect major and perfect minor chords with duplication of their fundamental, their fifth and their third, as well as major 7th and minor 7th chords with duplication of their fundamental and their fifth. These chords have been always played with both hands and with a minimum separation of two octaves between the lowest note and the highest note. In most cases, this separation is four or five octaves, so the coincidences between partials of sounds with octave or fifth relation are smaller and the octave and fifth tests attain better performance.
The recorded chords satisfy the statistical profile discovered by Krumhansl in classical Western music [30], that is, octave relationships are the most frequently, followed by consonant musical intervals (perfect fifth, perfect fourth) and the smallest probability of occurrence is given to dissonant intervals (minor second, augmented fifth, etc.). Note that these are the types of chords actually used in Western music. In general, these chords are more difficult to resolve that the chords that are just composed with dissonant intervals [21].
The error measure employed is the note error rate (NER) metric. The NER is defined as the mean number of erroneously detected notes divided by the number of notes in the chords [21]:

where Substitution errors (SE): happen when a note, that does not exist in the chord, is detected as played note, Deletion errors (DE): appear when the number of detected notes is smaller than the number of notes in a chord, Insertion errors (IE): appear when the number of detected notes is larger than the number of notes in a chord, NN: represents the number of notes in the chords.
It is worth mentioning that insertion errors (IE) never occurred in the proposed PIC detector in the tests done and the deletion errors only occur when the polyphony number is estimated.
Concerning the temporal resolution, windows with  samples were chosen. This choice gives a temporal resolution of about 371 ms and a spectral resolution of 2.69 Hz, which is the minimum resolution to distinguish the fundamental frequencies of the lowest notes of the piano.
After several tests, and according to the results obtained for the CDMA signal in [18], a 3-stage PIC was chosen whose cancellation parameters are  [23]. It has been observed that this choice provides a good balance between performance and complexity. A comparison of note error rates for PIC with 3, 5, or 7 stages and using 4 different sets of cancellation parameters are presented in Figure 7. The sets of cancellation parameters evaluated are as follows:
-
(i)
"1 set": in this set, all the cancellation parameters are 1 (total interference cancellation is attempted at each stage) [31].
-
(ii)
"0.5 set": in this set all the cancellation parameters are 0.5.
-
(iii)
"Tardón set": in this set the cancellation parameters are defined as [25]:
 (15)
(15)where
 is the stage and
  the number of stages of the receiver.
 -
(iv)
"Divsalar set": in this set the cancellation parameters are
 [23].
[23].

 is the stage and
  the number of stages of the receiver.
 [
[
Comparison of note error rates for different sets of cancellation parameters and different number of parallel interference cancellation stages.
Figure 7 shows that the cancellation parameters proposed by Divsalar attain the best NER. On the other hand, for "1 set" the NER increases with the number of stages, this is due to the errors cancellation errors are accumulated because the cancellation in each stages is 100%. However, for "0.5 set" and "Tardón set" the NER decreases with the number of stages because the cancellation in each stage is small enough so that the cancellation errors do not negatively affect the detection performance of subsequent stages. Note that these sets require many interference cancellation stages (large computational burden) to attain the optimum performance which is attained with  . However, the "Divsalar set", with interference cancellation stages, attains better performance than the other two sets of parameters with seven stages.
In Figure 8, a comparison of the NER for different polyphony numbers using the proposed PIC detector and the iterative estimation and cancellation reference method proposed in [4] is presented. In this case the polyphony number is known. Note that the method selected for comparison in [4] performs the detection of the notes in a successive way using a band wise F0 estimation for general purpose multiple F0 detection. However, our method performs the detection in a parallel way using specific note patterns. The dataset employed in the comparison was described at the beginning of this section.

Comparison of note error rates for different polyphony numbers using the proposed PIC detector and the selected reference method proposed in [4]. Polyphony number known in both methods.
It is worth mentioning that the errors are just substitution errors in both methods because the polyphony number is known. In this case, the output vector ( ) is completed, if it is necessary, with the discarded notes in
  and
and  for which the PIC output are larger. Recall that the proposed PIC detector never shows insertion errors and the deletion errors only occur when the polyphony number is estimated. As it can be observed in Figure 8, the NER increases with the polyphony number for both methods, however the proposed PIC detector gets better results and it can also deal with the low and high octaves of the piano. Note that the evaluation of the system in [4] is restricted to the range E1 to C7, because the F0s of the input dataset are restricted to that range. In this paper, we have evaluated, tuned and compared the systems in the range defined by all the piano notes. According to this choice, 12.5% of the notes are out of the range originally evaluated in [4].
There exists a gap in the performance between polyphony 4 and polyphony 5. This is due to the octave and fifth relations between the notes in these chords. In this case, the octave and fifth test sometimes fail when the chord includes several octaves and perfect fifths all together, because of the overlapping between the partials of more than three notes. On the other hand, the NER for a polyphony number of 6 is smaller than for polyphony number 5, the reason for this is the following: these chords have been always played with both hands and with a minimum of two octaves of separation between the lowest note and the highest note. In most cases, this separation is four or five octaves, so the coincidences between partials with octave or fifth relation are smaller and the octave and fifth test attain better performance.
If we also compare these results with the ones presented in [32], it should be taken into account that the evaluation of the system presented by Shi et al. [32] is made with sounds generated by mixing the sounds of different notes played solely and after a normalization of their amplitude to make the different notes of the same amplitude. However, the PIC detector proposed has been tested on recorded chords in which the different notes can be of different amplitudes and in which the chords are selected to be coherent and relevant from the musical point of view, as it has been presented at the beginning of this section.
Regarding the performance of the octave and fifth tests, Figure 9 represents the NER for octave, perfect fifth intervals and other intervals using the proposed PIC detector when the polyphony number is 2. In this figure, it can be observed that the NER for perfect fifth chords is smaller than the NER for octave intervals and other types of intervals.

Note error rates for octaves, perfect fifths and other intervals using the proposed PIC detector when the polyphony number is 2.
Note that the fifth test performs better than the octave test because the overlap of the partials of the note patterns of notes with octave relation is larger than in the case of notes with fifth relation. Also, fifth test is performed after octave test. On the other hand, the NER for octaves is the same as for other types of intervals. These results show that the octave and fifth tests are efficient, making the errors to become almost independent of the type of interval that composed the chord under analysis.
Figure 10 shows the NER of the PIC detector when the polyphony number is estimated in the note decision block. As it can be observed, the NER is not significantly increased with respect to the case in which the polyphony number is known. In this figure, substitution and deletion errors are shown because, when the polyphony number is estimated, deletion errors can appear. It can be observed that the deletion errors are less than substitution errors. If we compare these results with the ones presented in Figure 8, it is clear that the increase of NER found when the polyphony number is estimated is mainly due to deletion errors.

Note error rates for different polyphony numbers using the proposed PIC detector. Polyphony number estimated.
If we compare the results in Figure 10 with the ones presented in [21] for the different polyphony estimation strategies, it can be observed that the proposed PIC detector attains better NER. Also, the difference in the performance between the cases in which the polyphony number is known and the cases in which it is estimated is smaller. This is an indication of the robustness of the proposed detection system both as note detector and as estimator of the degree of polyphony.
Figure 11 shows the note error rates in different levels of noise for different polyphony numbers using the proposed PIC detector when the polyphony number is estimated. No differences between substitution and deletion errors are shown because the percentage of deletion and substitution errors are the same as in Figure 10.

Note error rates in different levels of noise for different polyphony numbers using the proposed PIC detector. Polyphony number estimated.
The noise variance has been selected so that the signal to noise ratio (SNR) is adjusted as in [21]. This figure shows that despite the NER increases with the noise, the proposed PIC system performs quite robustly in noisy cases. Again, the NER for a polyphony number of 6 is smaller than for polyphony number 5 because these chords have been always played with both hands, as previously described.
7. Conclusions
In this paper, a piano chords detector based on the idea of parallel interference cancellation has been presented. The proposed system makes use of the novel idea of modeling a segment of music as a third generation CDMA mobile communications signal. The model proposed considers each piano note as a CDMA user in which the spreading code is replaced by a representative note pattern defined in the frequency domain. This pattern is calculated by averaging the power spectral densities of different piano notes interpreted in various styles and with different pianos. This choice allows to attain good detection performance using these patterns regardless of the piano used to play the chord to be analyzed.
The structure of a multistage weighted PIC detector has been presented and it has been shown that the structure gets perfectly adapted to the purpose of the detection of the notes played in a chord. Since the spectral patterns of the notes are not orthogonal to each other, due to the harmonic relationships between the notes, and the different notes in a chord have different energies, a specific thresholding matrix has been designed for the task of deciding whether the PIC outputs correspond to real notes composing the chord. This matrix of thresholds is designed to be usable for any chord in any piano.
Finally, an additional stage that performs an octave test and a fifth test has been included. This stage eliminates false positives produced by the appearance of octave and fifth relations between the notes performed in the chord. It has been checked that these tests make the error rates in the detection of octaves and fifths to become similar to the ones found in the detection of any other type of interval.
The proposed system attains very good results in both the detection of the notes that compose a chord and the estimation of the polyphony number. Moreover, it has been observed that the detection performance is not noticeably affected by the estimation of the polyphony number with respect to the situations in which the polyphony number is known.
References
Klapuri AP: Automatic music transcription as we know it today. Journal of New Music Research 2004, 33(3):269-282. 10.1080/0929821042000317840
Hainsworth SW: Analysis of musical audio for polyphonic transcription. In 1st year report. Department of Engineering, University of Cambridge, Cambridge, UK; 2001.
Goto M: A real-time music-scene-description system: predominant-F0 estimation for detecting melody and bass lines in real-world audio signals. Speech Communication 2004, 43(4):311-329. 10.1016/j.specom.2004.07.001
Klapuri AP: Multiple fundamental frequency estimation by summing harmonic amplitudes. Proceedings of the 7th International Conference on Music Information Retrieval (ISMIR '06), 2006 216-221.
Klapuri A: Multipitch analysis of polyphonic music and speech signals using an auditory model. IEEE Transactions on Audio, Speech and Language Processing 2008, 16(2):255-266.
Kashino K, Nakadai K, Kinoshita T, Tanaka H: Application of Bayesian probability network to music scene analysis. Proceedings of IJCAI Workshop on Computational Auditory Scene Analysis (CASA '95), 1995 52-59.
Kashino K, Nakadai K, Kinoshita T, Tanaka H: Organization of hierarchical perceptual sounds: music scene analysis with autonomous processing modules and a quantitative information integration mechanism. Proceedings of the 14th International Joint Conference on Artificial Intelligence (IJCAI '95), August 1995, Montreal, Canada 1: 158-164.
Dixon S: Extraction of musical performance parameters from audio data. Proceedings of the 1st IEEE Pacific-Rim Conference on Multimedia, 2000 42-45.
Tolonen T, Karjalainen M: A computationally efficient multipitch analysis model. IEEE Transactions on Speech and Audio Processing 2000, 8(6):708-716. 10.1109/89.876309
Vincent E, Plumbley MD: Predominant-F0 estimation using Bayesian harmonic waveform models. Proceedings of the 1st Annual Music Information Retrieval Evaluation eXchange (MIREX '05), September 2005
Marolt M: Transcription of polyphonic piano music with neural networks. Proceedings of the 10th Mediterranean Electrotechnical Conference (MALECON '00), May 2000 2: 512-515.
Marolt M: A connectionist approach to automatic transcription of polyphonic piano music. IEEE Transactions on Multimedia 2004, 6(3):439-449. 10.1109/TMM.2004.827507
Barbancho AM, Entrambasaguas JT, Barbancho I: CDMA systems physical function level simulator. Proceedings of the IASTED International Conference on Advances in Communications (AIC '01), 2001 61-66.
Proakis JG: Digital Communications. 3rd edition. McGraw-Hill, New York, NY, USA; 1995.
Verdu S: Multiuser Detection. Cambridge University Press, Cambridge, UK; 1998.
Rossing TD, Moore FR, Wheeler PA: The Science of Sound. 3rd edition. Addison Wesley, San Francisco, Calif, USA; 2002.
Koulakiotis D, Aghvami AH: Data detection techniques for DS/CDMA mobile systems: a review. IEEE Personal Communications 2000, 7(3):24-34. 10.1109/98.847920
Barbancho AM, Tardón LJ, Barbancho I: Analytical performance analysis of the linear multistage partial PIC receiver for DS-CDMA systems. IEEE Transactions on Communications 2005, 53(12):2006-2010. 10.1109/TCOMM.2005.860087
Dinan EH, Jabbari B: Spreading codes for direct sequence CDMA and wideband CDMA cellular networks. IEEE Communications Magazine 1998, 36(9):48-54. 10.1109/35.714616
Goto M: Development of the RWC music database. Proceedings of the 18th International Congress on Acoustics, April 2004 1: 553-556.
Klapuri AP: Multiple fundamental frequency estimation based on harmonicity and spectral smoothness. IEEE Transactions on Speech and Audio Processing 2003, 11(6):804-816. 10.1109/TSA.2003.815516
Oppenheim AV, Schafer RW: Discrete-Time Signal Processing. Prentice Hall, Englewood Cliffs, NJ, USA; 1989.
Divsalar D, Simon MK: Improved parallel interference cancellation for CDMA. IEEE Transactions on Communications 1998, 46(2):258-268. 10.1109/26.659484
Guo D, Rasmussen LK, Sun S, Lim TJ, Cheah C: MMSE-based linear parallel interference cancellation in CDMA. Proceedings of the 5th IEEE International Symposium on Spread Spectrum Techniques and Applications, September 1998 3: 917-921.
Tardón LJ, Palacios E, Barbancho I, Barbancho AM: On the improved multistage partial parallel interference cancellation receiver for UMTS. Proceedings of the 60th IEEE Vehicular Technology Conference (VTC '04), September 2004 4: 2321-2325.
Chien Y-R, Jeng S-K: An automatic transcription system with octave detection. Proceedings of the IEEE International Conference on Acoustic, Speech and Signal Processing (ICASSP '02), May 2002, Orlando, Fla, USA 2: 1865-1868.
Schutz A, Slock D: Periodic signal modeling for the octave problem in music transcription. Proceedings of the 16th International Conference on Digital Signal Processing (DSP '09), July 2009 1-6.
Loy G: Musimathics, Volume 1: The Mathematical Foundations of Music. The MIT Press, Cambridge, Mass, USA; 2006.
Backus J: The Acoustical Foundations of Music. 2nd edition. W.W. Norton & Company, New York, NY, USA; 1977.
Krumhansl CL: Cognitive Foundation of Musical Pitch. Oxford University Press, New York, NY, USA; 1990.
Buehrer RM, Nicoloso SP: Comments on "partial parallel interference cancellation for CDMA". IEEE Transactions on Communications 1999, 47(5):658-661. 10.1109/26.768754
Shi L, Zhang J, Han G: Multiple fundamental frequency estimation based on harmonic structure model. Proceedings of the 2nd International Congress on Image and Signal Processing (CISP '09), October 2009, Tianjin, China 1-4.
Acknowledgments
This work has been funded by the Ministerio de Educación y Ciencia of the Spanish Government under Project no. TSI2007-61181. The authors would like to thank Dr. Anssi Klapuri from Queen Mary University of London, UK, for offering them a reference method to compare the performance of the proposed system.
Author information
Authors and Affiliations
Corresponding author
Rights and permissions
Open Access This article is distributed under the terms of the Creative Commons Attribution 2.0 International License (https://creativecommons.org/licenses/by/2.0), which permits unrestricted use, distribution, and reproduction in any medium, provided the original work is properly cited.
About this article
Cite this article
Barbancho, A.M., Tardón, L.J. & Barbancho, I. PIC Detector for Piano Chords. EURASIP J. Adv. Signal Process. 2010, 179367 (2010). https://doi.org/10.1155/2010/179367
Received:
Revised:
Accepted:
Published:
DOI: https://doi.org/10.1155/2010/179367